Skip to content
v3.4.0Release notes

Debug everything.Ship nothing.

On-device debugging toolkit for Android. In release builds the API calls are no-ops.

  • 23 tools
  • API 23+
  • OkHttp and Ktor
  • Open source
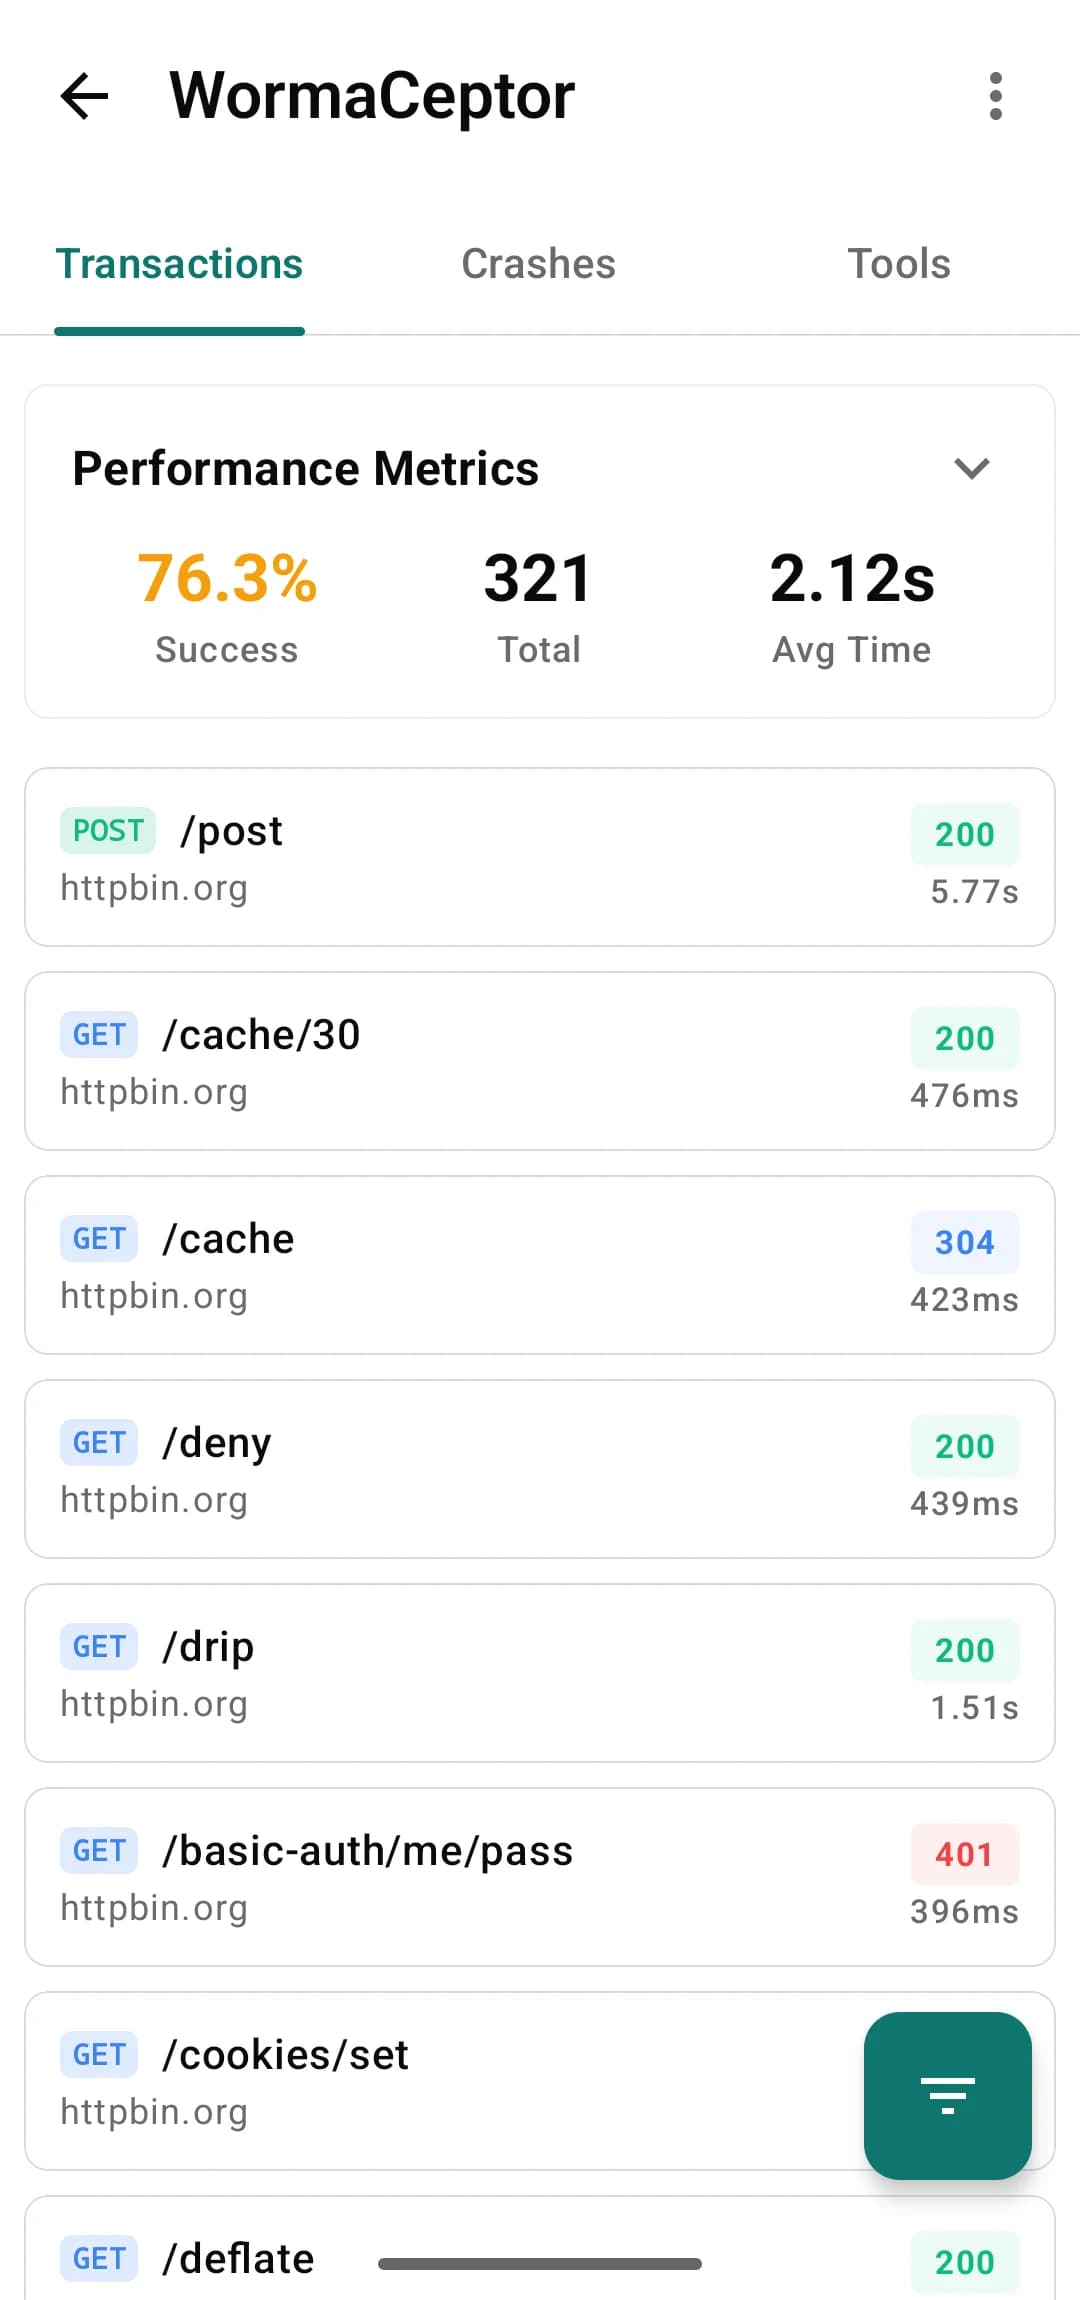
Transaction list with captured HTTP requests, status codes, and durations
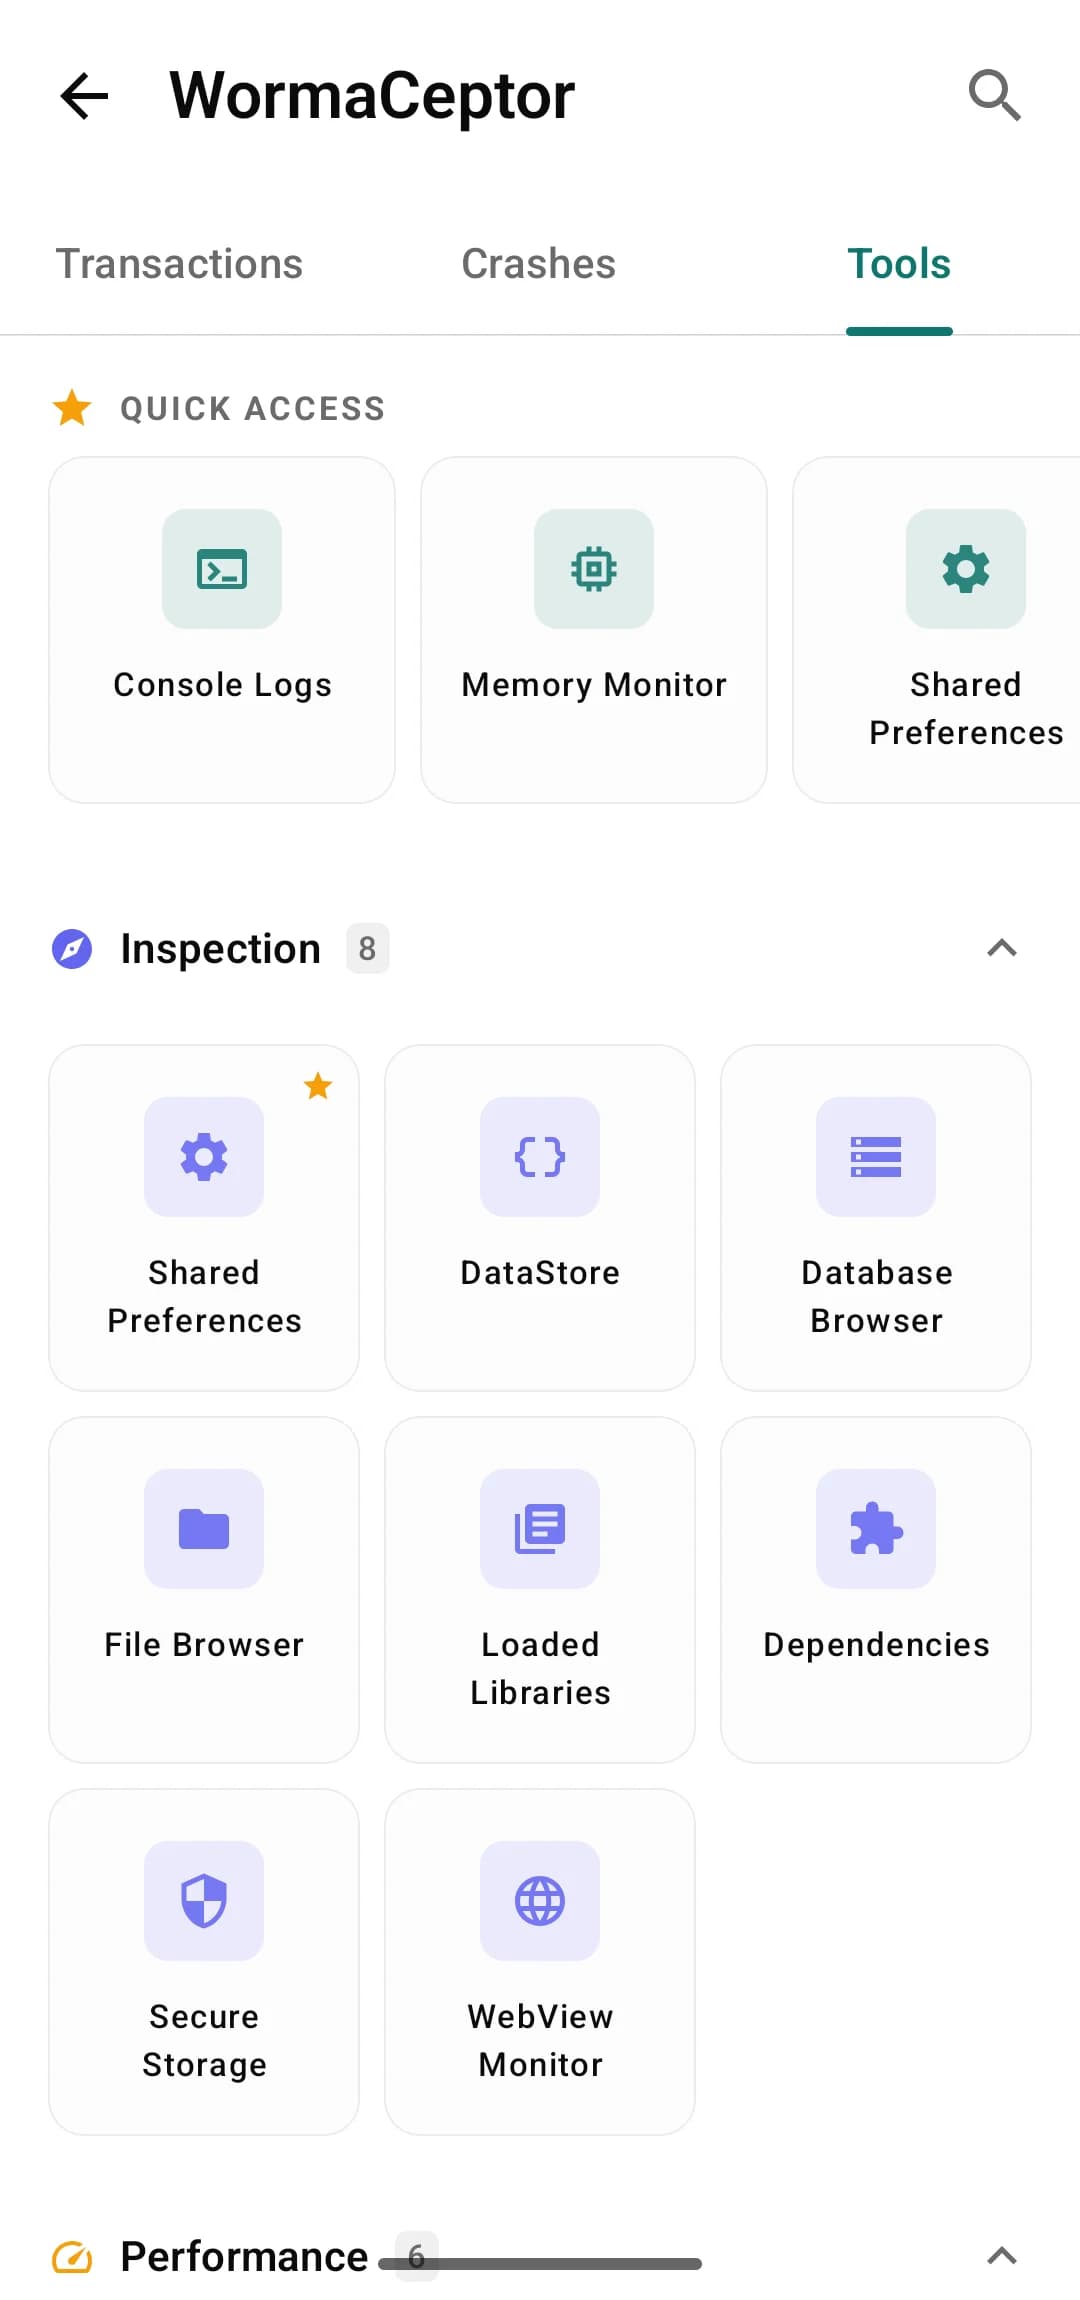
WormaCeptor tools screen listing the available debugging tools
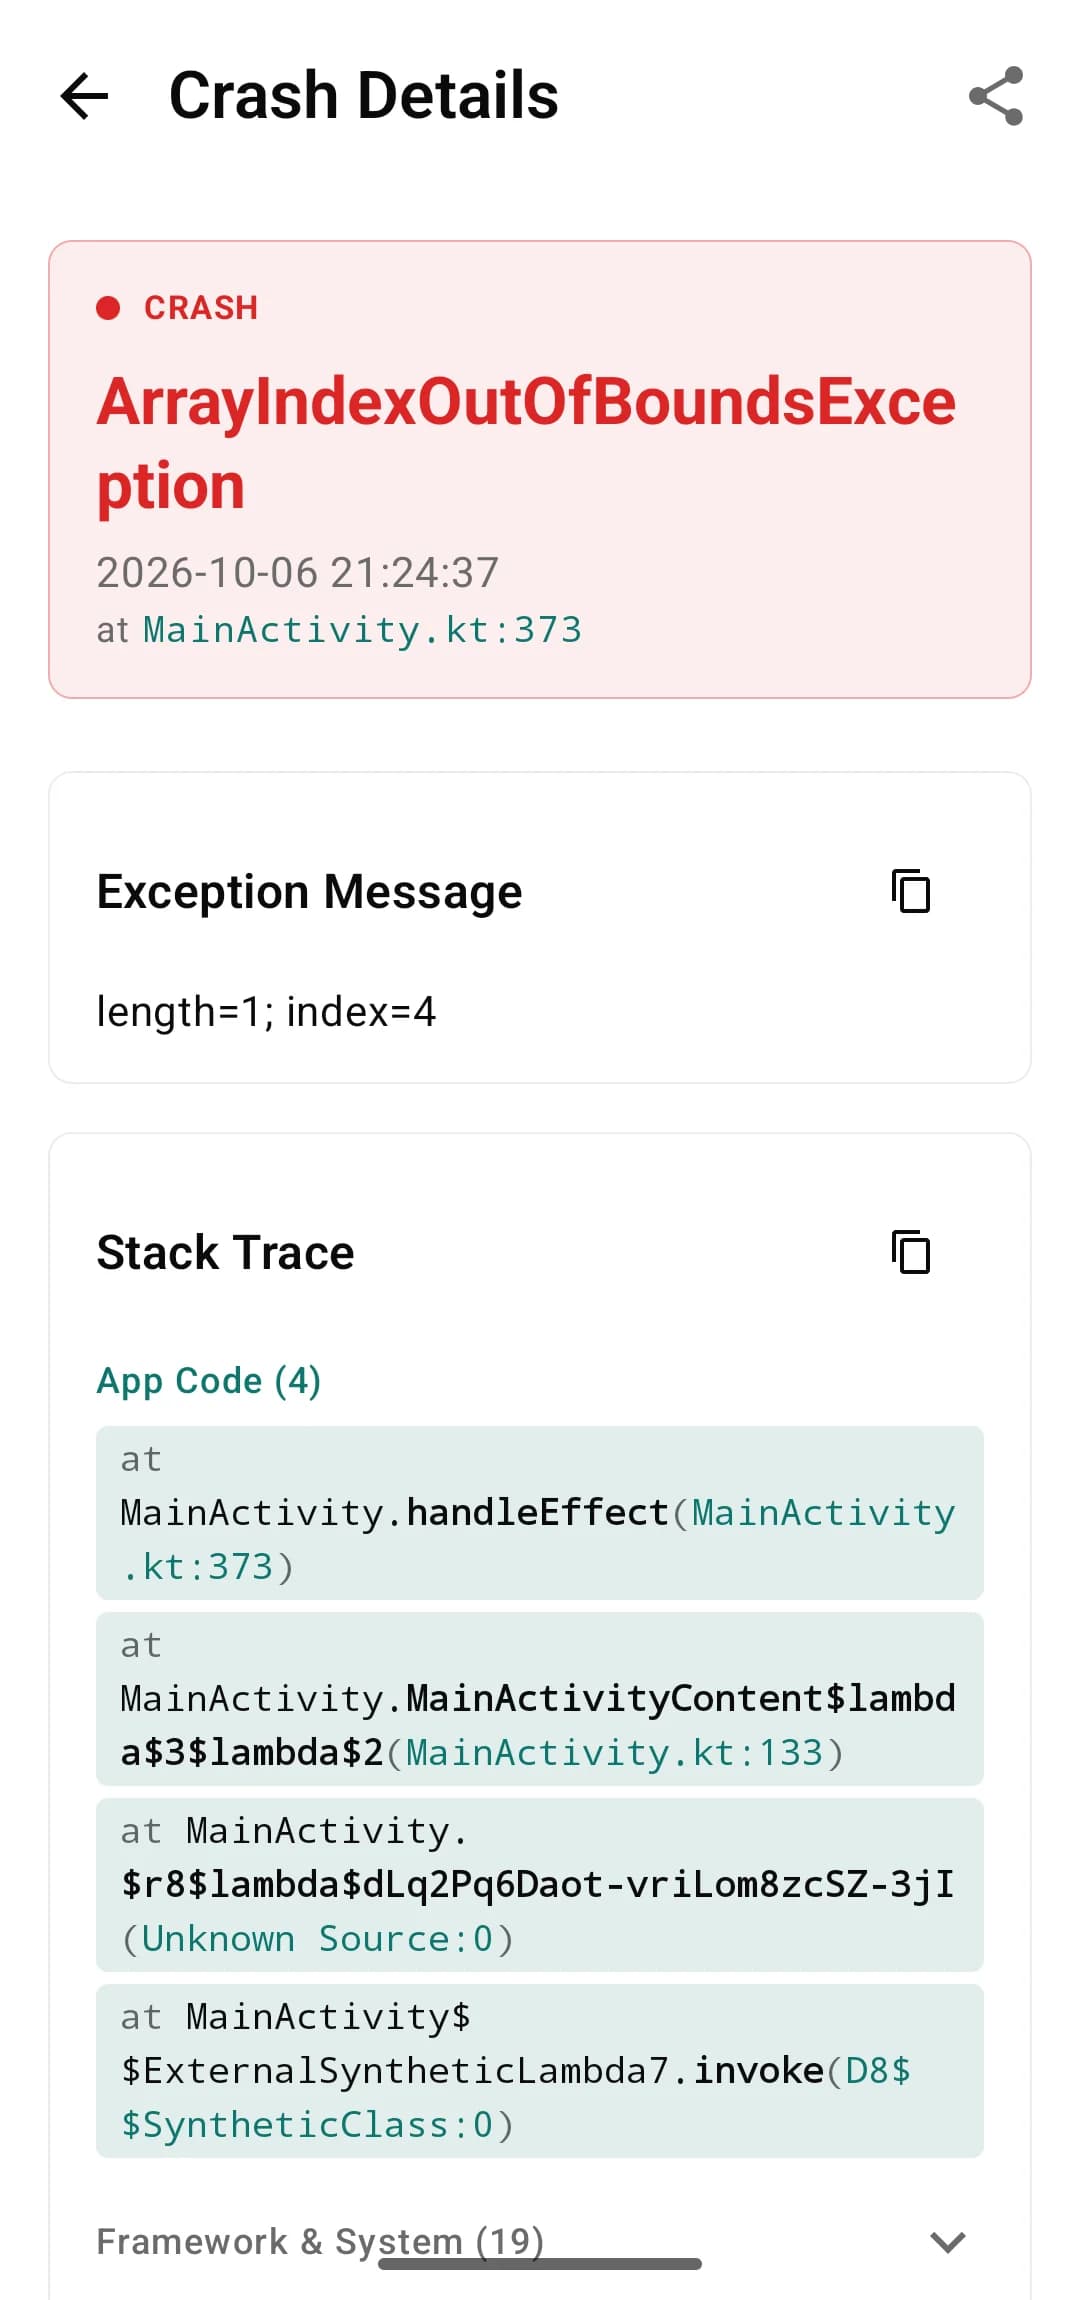
Crash details screen with the exception and stack trace

Release model

What ships in release

WormaCeptor is split into a client you add to every build and an implementation you add to debug builds only.

build.gradle.kts
dependencies {
    // every build
    implementation("com.azikar24.wormaceptor:wormaceptor-client:3.4.0")
    // debug builds only
    debugImplementation("com.azikar24.wormaceptor:wormaceptor-persistence:3.4.0")
}

Debug build

implementation + debugImplementation

  • Client API and core engine
  • UI, storage, and every feature module
  • Opens from a shake, the floating button, the notification, or a deep link

Release build

implementation only

  • Client API and core engine
  • init() finds no implementation, so every call is a no-op
  • No UI, storage, or feature modules
  • No ProGuard rules to add

What's included

Tools inside your debug build

An HTTP inspector and crash reporter that are always on, plus 23 tools you can turn off with init(features = setOf(...)). Each tool also opens from a wormaceptor:// deep link, shown next to each tool below.

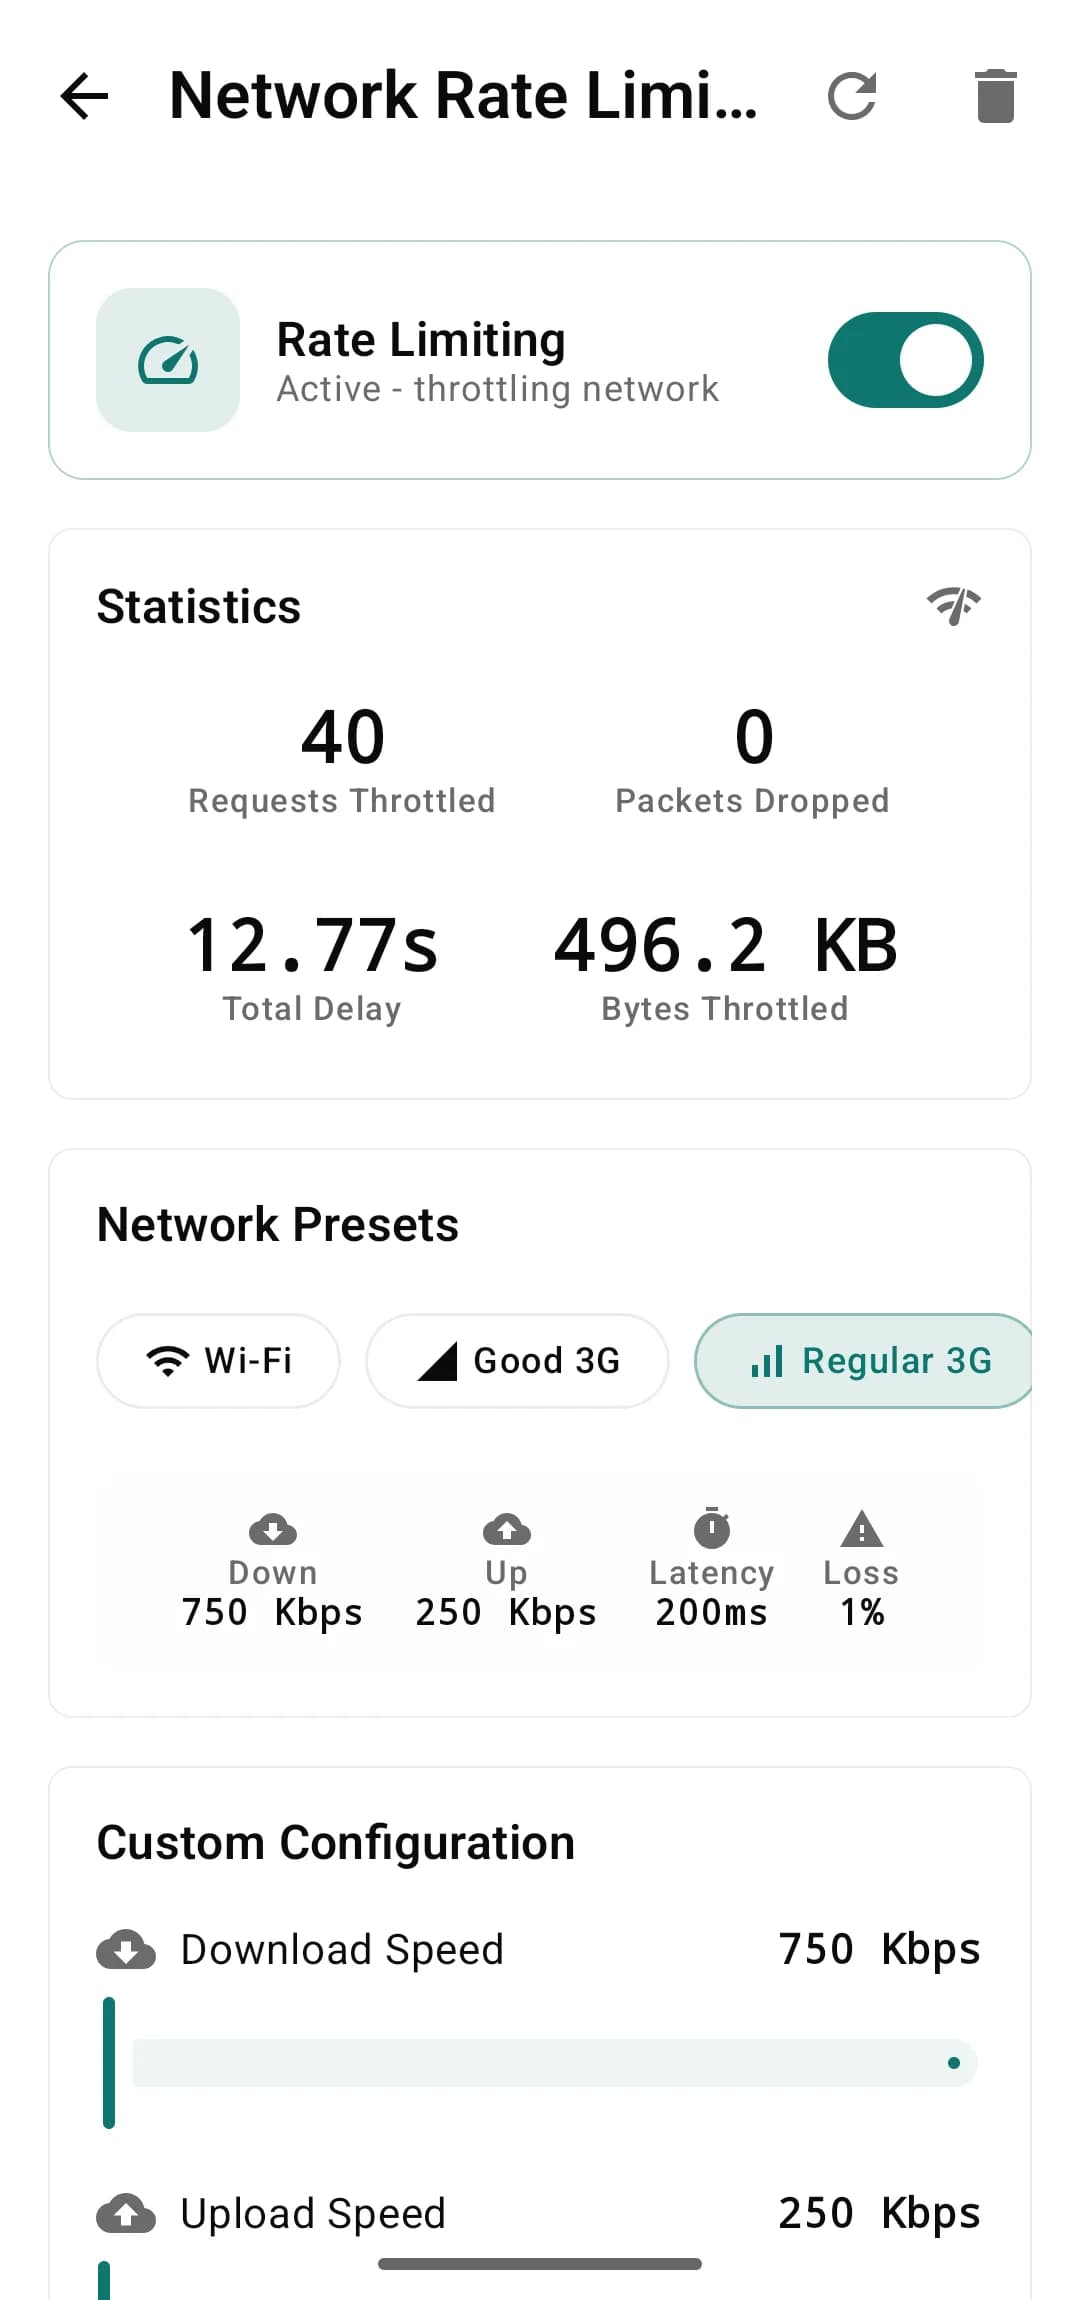
Rate limiter screen with network speed presets

Network

5 tools
  • HTTP inspectortransactions

    Requests and responses from OkHttp and Ktor, with TLS version. Export as cURL, JSON, or HAR. Docs

  • WebSocket monitortools/websocket

    Connections and messages through a wrapped OkHttp listener. Docs

  • WebView monitortools/webviewmonitor

    Page loads and JavaScript execution inside WebViews. Docs

  • Mock rules

    Override HTTP responses at the interceptor level.

  • Rate limitertools/ratelimit

    Throttle the network with Wi-Fi, 3G, 2G, EDGE, and Offline presets.
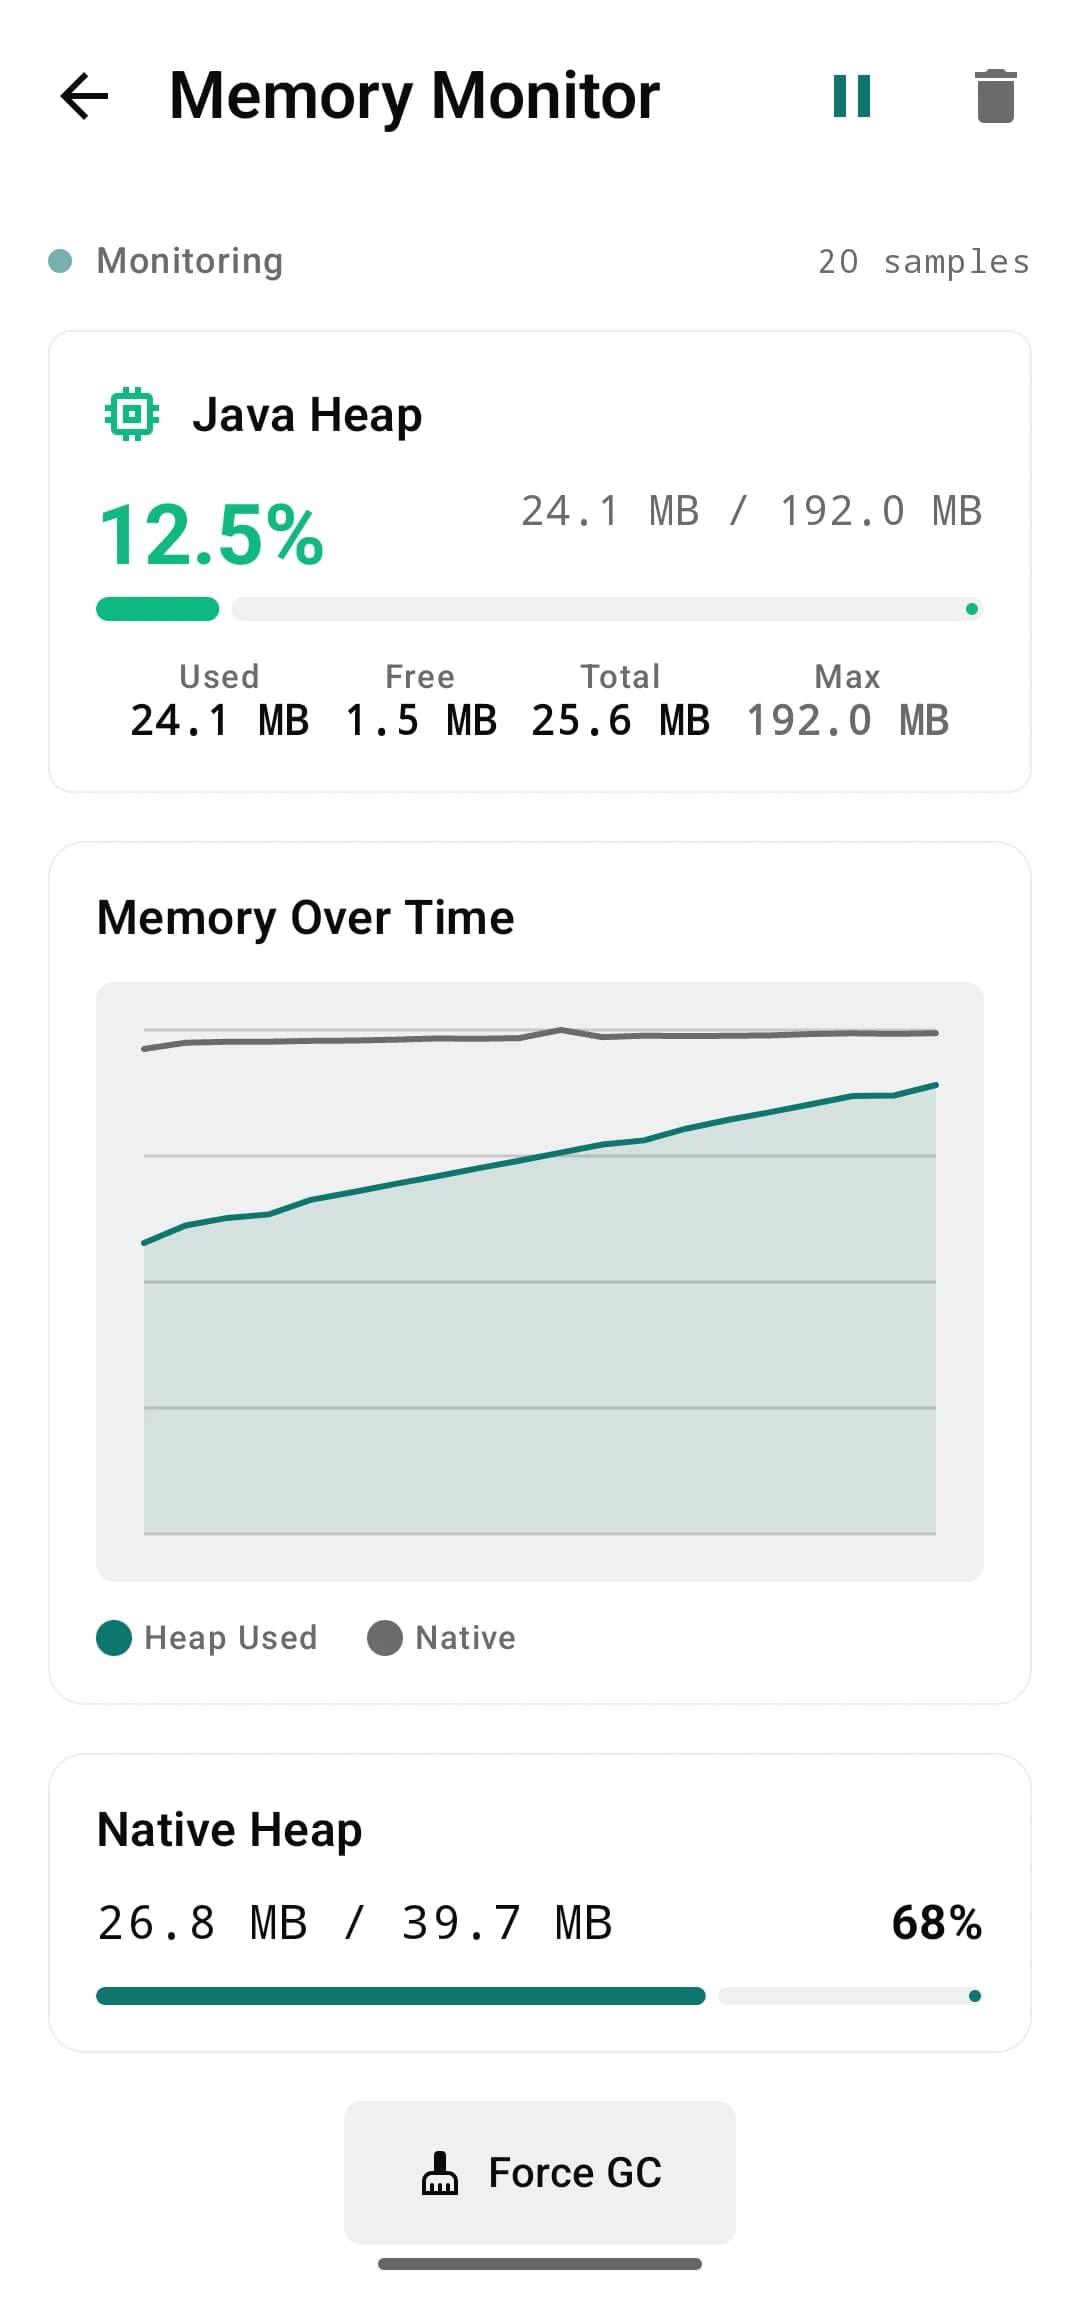
Memory monitor showing heap usage over time

Performance

5 tools
  • FPS monitortools/fps

    Frame rate, with frames over 32 ms flagged as jank.

  • Memory monitortools/memory

    Heap usage with thresholds at 60% and 80%.

  • CPU monitortools/cpu

    Overall and per-core CPU usage.

  • Performance overlay

    Floating badge with live FPS, memory, and CPU. Docs

  • Recomposition counter

    Counts Jetpack Compose recompositions on the device. Docs

Crash details screen with the exception and stack trace

Stability

4 tools
  • Crash reportercrashes

    Uncaught exceptions with full stack traces.

  • Leak detectiontools/leakdetection

    Finds leaked Activities. Watch Fragments and other objects with watchObject.

  • Thread violationstools/threadviolation

    StrictMode reports of disk and network work on the main thread.

  • Logcat viewertools/logs

    Your app's log output, on the device.

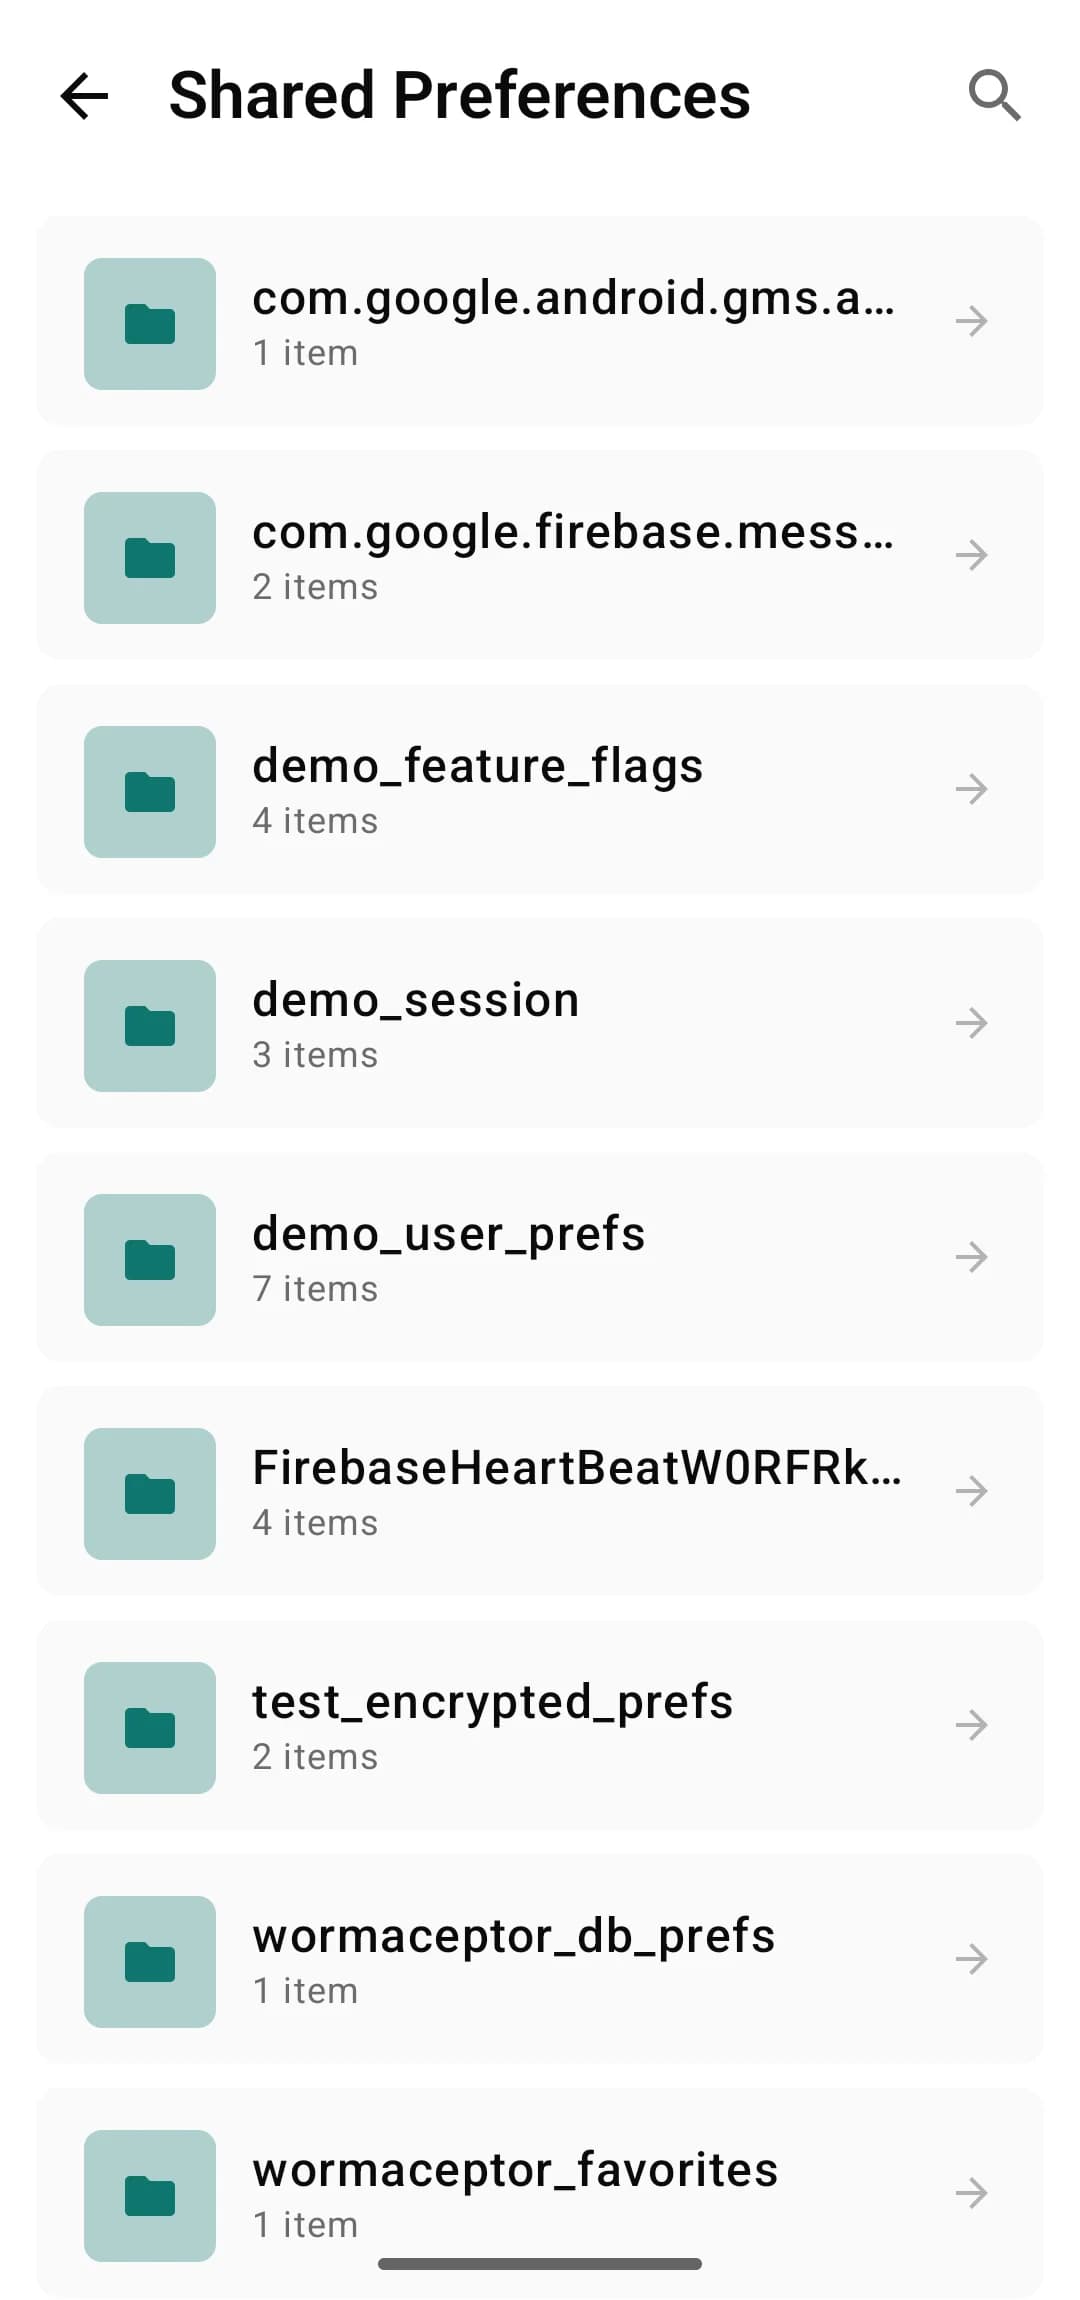
SharedPreferences viewer listing preference keys and values

Storage

5 tools
  • SharedPreferencestools/preferences

    View and edit preference files.

  • DataStoretools/datastore

    Browse Preferences DataStore files, read-only.

  • Secure storagetools/securestorage

    Browse EncryptedSharedPreferences.

  • SQLite browsertools/database

    Browse tables and run SQL queries.

  • File browsertools/filebrowser

    Browse the app's files and directories.

App info

3 tools
  • Device infotools/deviceinfo

    Device, OS, and app details.

  • Dependenciestools/dependencies

    Gradle dependencies and their versions.

  • Native librariestools/loadedlibraries

    Native libraries loaded by the app.

Simulation

4 tools
  • Locationtools/location

    Set a mock GPS location through a mock provider.

  • Push notificationstools/pushsimulator

    Send test notifications to your app.

  • Push tokenstools/pushtoken

    View and copy FCM and HMS tokens.

  • Cryptotools/crypto

    AES, DES, 3DES, and RSA, with Base64 and Hex encoding.

Workflows

Common workflows

A short demo, then four tasks step by step.

Track down a slow API call

  1. Open WormaCeptor with a shake, the floating button, or the notification
  2. Filter transactions by endpoint
  3. Check timing, headers, and the full response
  4. Export the request as cURL and share it with your backend team

Find the cause of scroll jank

  1. Turn on the performance overlay
  2. Scroll and watch FPS; frames over 32 ms count as jank
  3. Compare with memory and CPU usage
  4. Check thread violations for disk or network work on the main thread

Read a crash on a QA device

  1. Open the Crashes tab on the device
  2. Read the full stack trace
  3. Check the network transactions from the same session
  4. Read the logs leading up to the crash

Test on a slow network

  1. Open the rate limiter and pick the 3G or EDGE preset
  2. Use the app and watch requests slow down
  3. Switch to Offline to check error handling
  4. Mock a location to test location-aware screens

MCP serverNew in 3.4.0

Let an AI agent read your debug build

An MCP server inside the debug app exposes 44 tools. A bridge on your computer connects it to your coding agent over ADB and stdio.

An agent can read

  • HTTP transactions and their request and response bodies
  • WebSocket connections and messages
  • Crashes, logs, leaks, and thread violations
  • CPU, memory, and FPS stats
  • SharedPreferences, secure storage, files, and SQL queries on app databases

And it can

  • Create and toggle mock rules, or mock a captured response
  • Replay a request or export it as cURL
  • Wait for the next matching request or crash
  • Set or stop a mock location
  • Send a test push notification
  • Change the rate limit
  1. Coding agentYour editor
  2. BridgeYour computer
  3. MCP serverDebug app
tools/call
{
  "name": "list_transactions",
  "arguments": {
    "query": "500",
    "limit": 5
  }
}

Lists up to five transactions whose URL, method, or status matches 500.

Read the MCP docs

Setup

Running in three steps

Add the dependencies, call init once, and attach the OkHttp interceptor or the Ktor plugin.

build.gradle.kts
dependencies {
    implementation("com.azikar24.wormaceptor:wormaceptor-client:3.4.0")
    debugImplementation("com.azikar24.wormaceptor:wormaceptor-persistence:3.4.0")
    // or wormaceptor-imdb: in-memory, not persisted
}

FAQ

Questions

Is WormaCeptor free?

Yes. WormaCeptor is open source, and the license is in the GitHub repository.

What is the minimum Android version?

API 23 (Android 6.0).

Does my app need Jetpack Compose?

No. WormaCeptor's own UI uses Compose internally. Your app can use Views, Compose, or both.

Which HTTP clients are supported?

OkHttp 4.x through WormaCeptorInterceptor and Ktor 3.x through WormaCeptorKtorPlugin.

Can it inspect WebSocket traffic?

Yes. Wrap your OkHttp WebSocketListener with WormaCeptorWebSocket.wrap and WormaCeptor records the connection and its messages.

What ships in a release build?

The client API and core engine, added with implementation. The UI, storage, and feature modules are added with debugImplementation, so in release init() finds no implementation and every call is a no-op. No ProGuard rules are needed.

Is captured data kept between app launches?

With wormaceptor-persistence, yes: data is stored on the device. With wormaceptor-imdb, data stays in memory and is gone when the process ends.

Can I turn tools off?

Yes. Pass the tools you want to init, for example WormaCeptorApi.init(this, features = setOf(Feature.MEMORY_MONITOR)). The HTTP inspector and crash reporter are always on.

Can it run next to other OkHttp interceptors?

Yes. WormaCeptorInterceptor is a standard OkHttp Interceptor, so it works alongside the others in your chain.